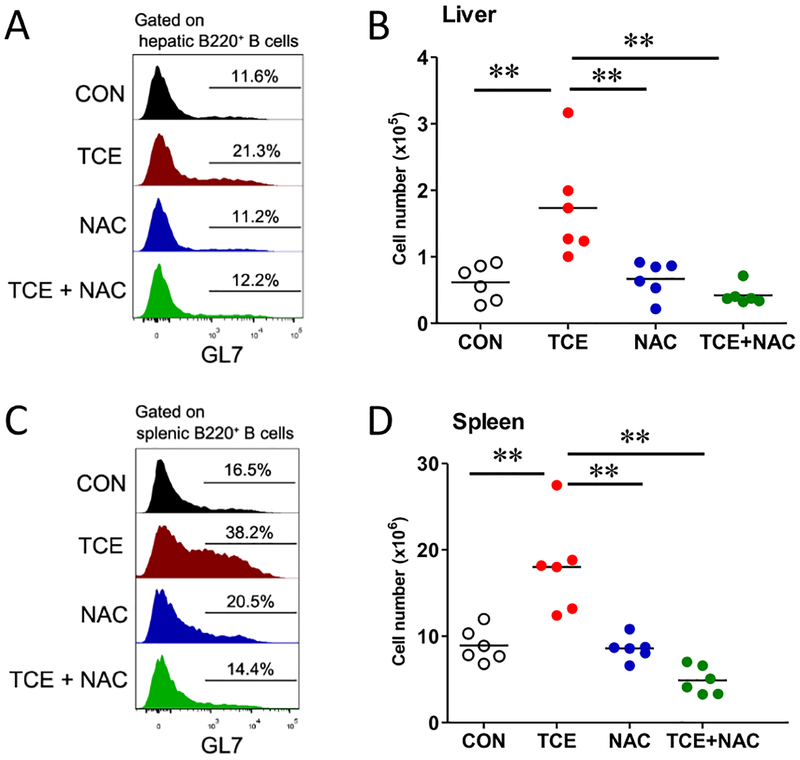
Fig. 4. TCE exposure led to B cell activation in the liver and spleen, which was attenuated by NAC treatment.
Flow cytometric analysis of GL7+B220+ B cells from liver and spleen of TCE-exposed mice. Histogram of GL7 expression on B cells from liver (A) and spleen (C). Cell counts of the indicated cell populations in liver (B) and spleen (D). Each symbol represents an individual mouse, and horizontal lines indicate the mean. *p<0.05; **p<0.01.

