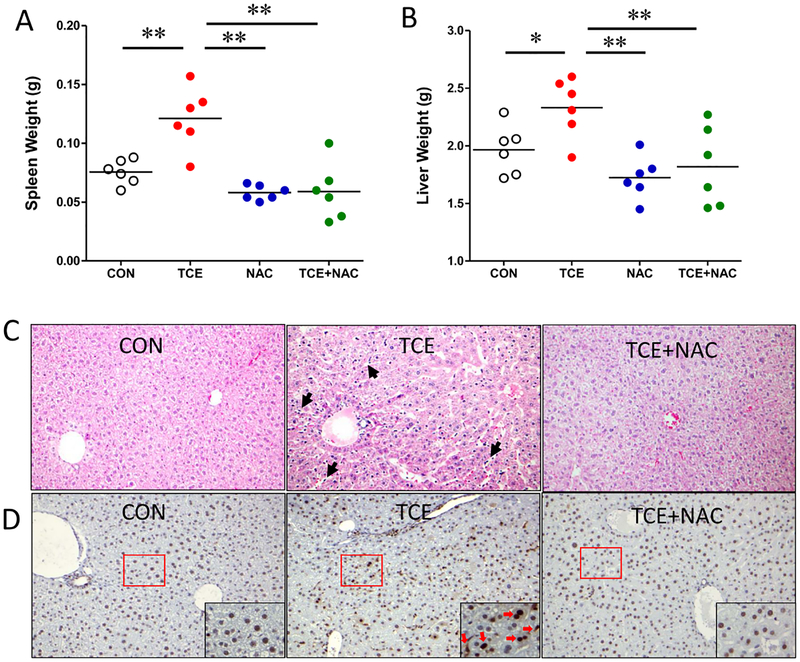
Fig. 6. Restoration of TCE-induced hepatic histological changes by NAC.
(A-B) Spleen and liver weights. Each symbol represents an individual mouse, and horizontal lines indicate the mean. (C) Representative liver sections with H&E. Arrow indicates the sinusoidal dilation and hyper-cellularity in TCE treated group. (D) Immunohistochemical staining for PCNA highlights cellular proliferation.

