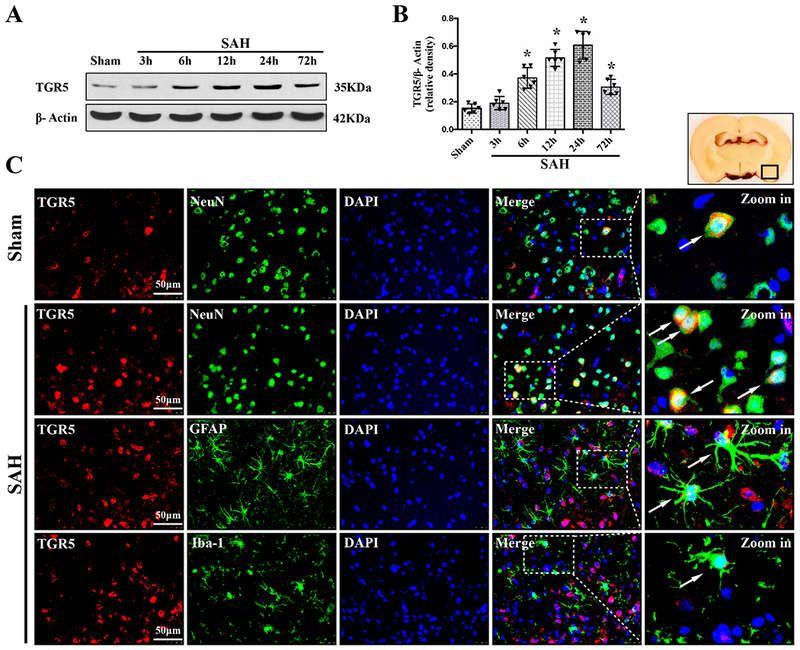
Figure 2. Times course of TGR5 expressions as well as cellular localization of TGR5 receptor after SAH.

Representative western blot bands of time course (A) and densitometric quantification of TGR5 (B) in the ipsilateral hemisphere after SAH. Data was represented as mean ± SD. n=6 per group. *P<0.05 vs. Sham group; One-way ANOVA, Tukey’s post hoc test. (C) Representative microphotographs of co-immunofluorescence staining of TGR5 (red) with neurons (NeuN, green), astrocytes (GFAP, green), and microglia (Iba-1, green) in the ipsilateral basal cortex at 24 h after SAH. Nuclei were stained with DAPI (blue). A small black square within coronal section of brain indicated the location of where the immunofluorescence staining images were taken. n=2 per group.
