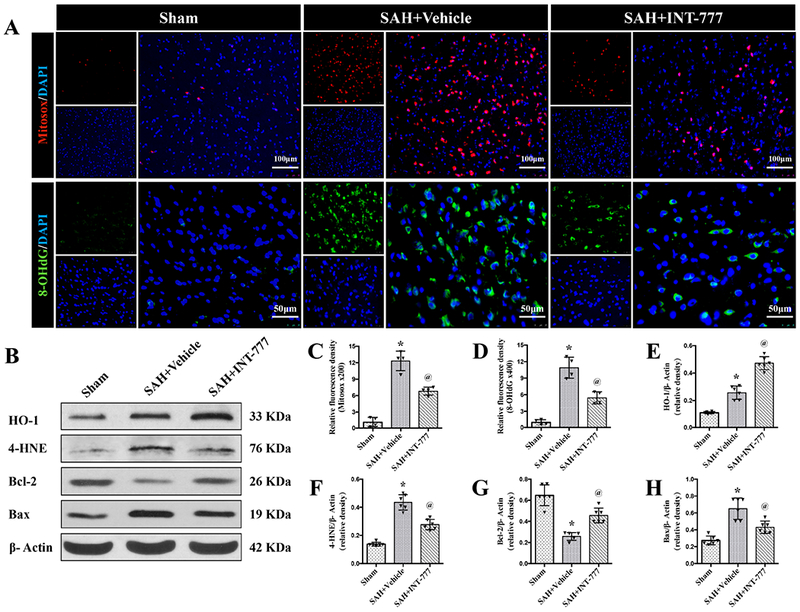
Figure 5. Effects of TGR5 activation with INT-777 on oxidative stress level and neuronal apoptosis at 24 h after SAH.

(A) Representative micrographs of Mitosox (red) and 8-OHdG (green) immunofluorescence staining in the ipsilateral basal cortex at 24 h after SAH. Nuclei were stained with DAPI (blue). (C-D) Quantitative analysis of Mitosox and 8-OHdG fluorescence intensity. A small black squares in the coronal section of brain indicated the area used for counting 8-OHdG and Mitosox-positive cells, n=4 per group. (B) Representative western blot bands and densitometric quantification of HO-1, 4-HNE, Blc-2, and Bax (E-H) in the ipsilateral hemisphere at 24 h after SAH, n=6 per group. Vehicle: 10% dimethyl sulfide. Data was represented as mean ± SD. *P<0.05 vs. Sham group; @P<0.05 vs. SAH+Vehicle group; One-way ANOVA, Tukey’s post hoc test.
