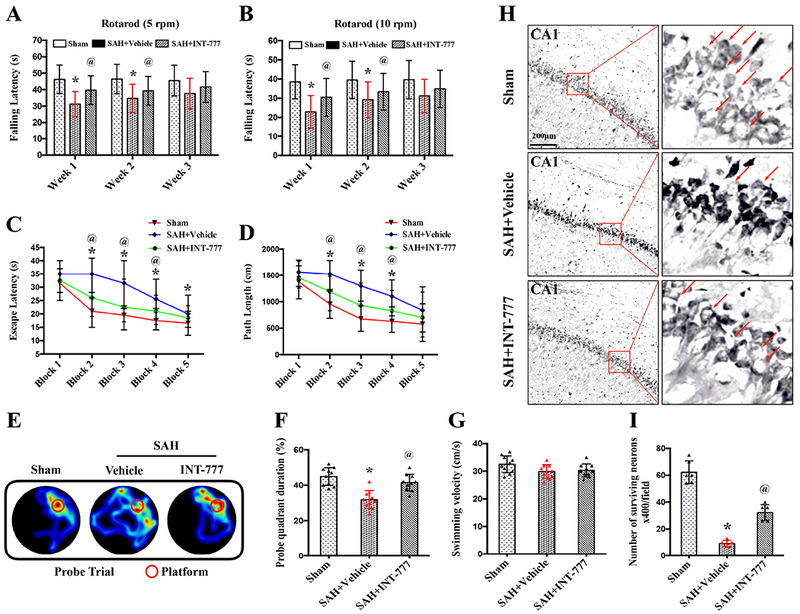
Figure 6. Effects of TGR5 activation with INT-777 on long-term (28 d) neurobehavioral outcome after SAH.

(A-B) Rotarod test on the first, second, third week after SAH. (C-D) Escape latency and swimming distance of Morris water maze test on days 23 to 27 after SAH. (E) Representative thermal imaging pictures of the probe trial. The red circles indicated the probe platform. (F) Quantification of probe quadrant duration in the probe trial on day 27 after SAH. (G) Swimming velocities of different groups in the probe trial. (H-I) Representative micrographs and neuronal quantifications of Nissl staining in hippocampal CA1 region. Arrows indicated the normal neurons. n=10 per group. Vehicle: 10% dimethyl sulfide. Data was represented as mean ± SD. *P<0.05 vs. Sham group; @P<0.05 vs. SAH+Vehicle group; Two-way repeated measures ANOVA, Tukey’s post hoc test (A-D), and Oneway ANOVA, Tukey’s post hoc test (F-G).
