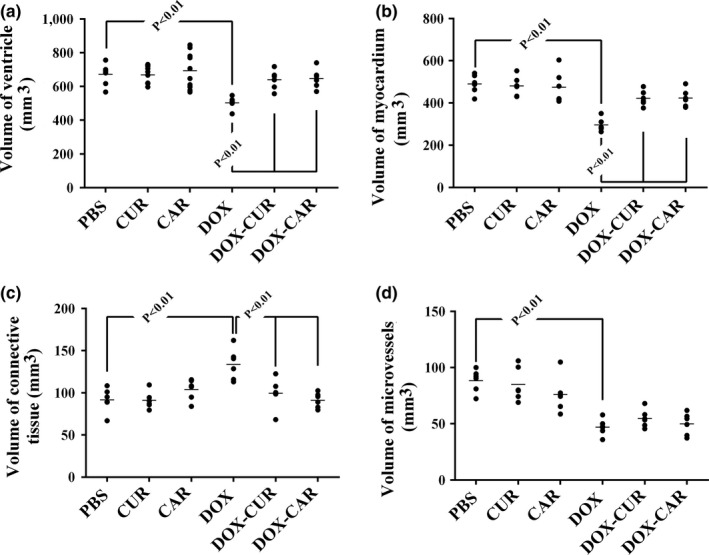
Figure 2.

The scatter plots of the quantified parameters of the ventricle in different groups, including phosphate‐buffered saline (PBS), curcumin (CUR), carvacrol (CAR), doxorubicin (DOX), DOX‐CUR, and DOX‐CAR. The volumes of the ventricle (a), myocardium (b), connective tissue (c), and microvessels (d) have been presented. Each dot represents an animal, and the horizontal bars indicate the means of the parameters in the study groups. p < .01, PBS versus DOX, DOX versus DOX‐CUR, and DOX versus DOX‐CAR
