
Figure 5.
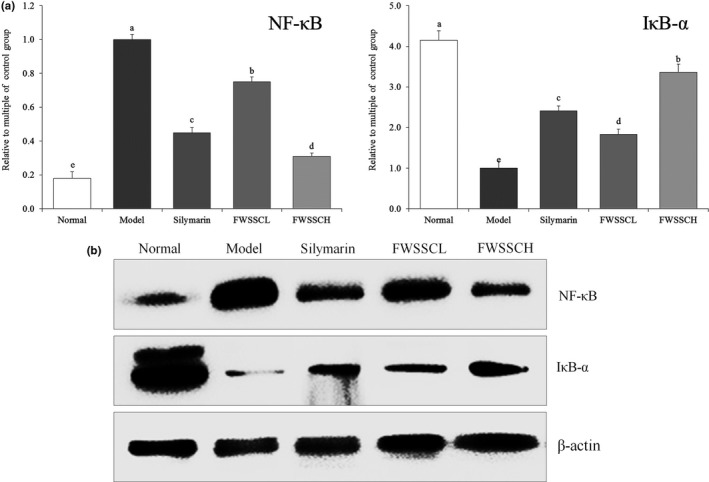
The mRNA (a) and protein (b) expression of NF‐κB and IκB‐α in the liver tissue of mice. Values presented are the mean ± standard deviation. a−eMean values with different letters in the bar are significantly different (p < .05) according to Duncan's new MRT. Silymarin group: 100 mg/kg b.w. silymarin treatment dose; FWSSCL group: 50 mg/kg b.w. Wushan Shencha flavonoids dose; FWSSCH group: 100 mg/kg b.w. Wushan Shencha flavonoids dose