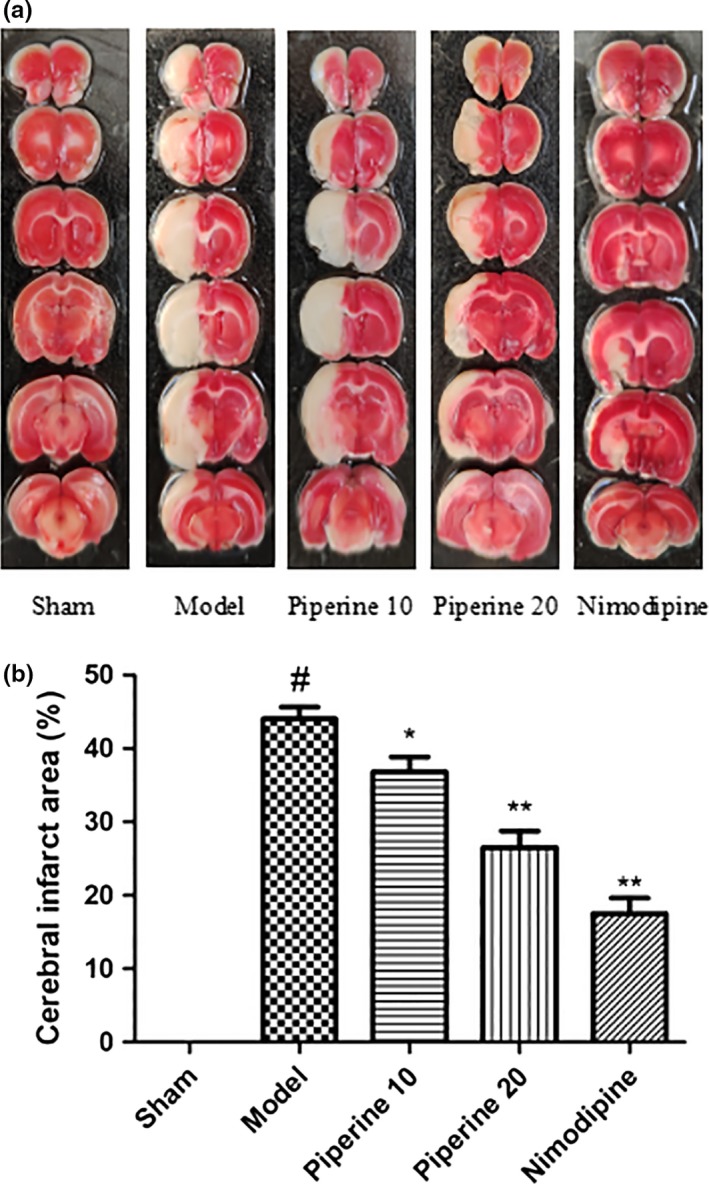
Figure 5.

Postpiperine treatment induced changes to the ischemic area. (a) Staining with TTC on the model group, sham group, piperine treatment groups as well as the nimodipine group. (b) Measurements of the area of cerebral ischemia. **p < 0.01in contrast to the model group, # p < .05, in contrast to the sham group; *p < .05, (n = 9~13)
