
Figure 8.
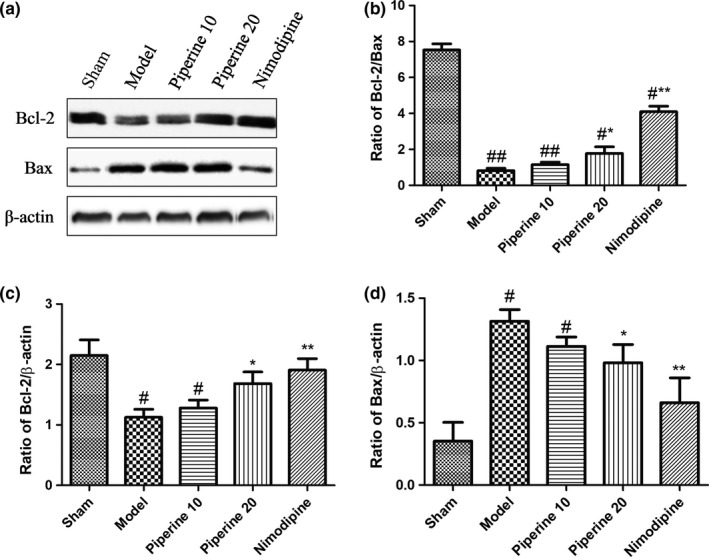
Effects of piperine on expression of Bcl‐2 and Bax in the cortex after pMCAO. (a) Represents western blot analysis of Bcl‐2 and Bax, β‐actin is shown as loading control. (b–d) Represents quantitative analysis of expression of Bcl‐2/Bax, Bcl‐2 and Bax. Data are expressed as means ± SD; n = 4. # p < .05, ## p < .01, versus sham group; *p < .05, **p < .01, versus model group