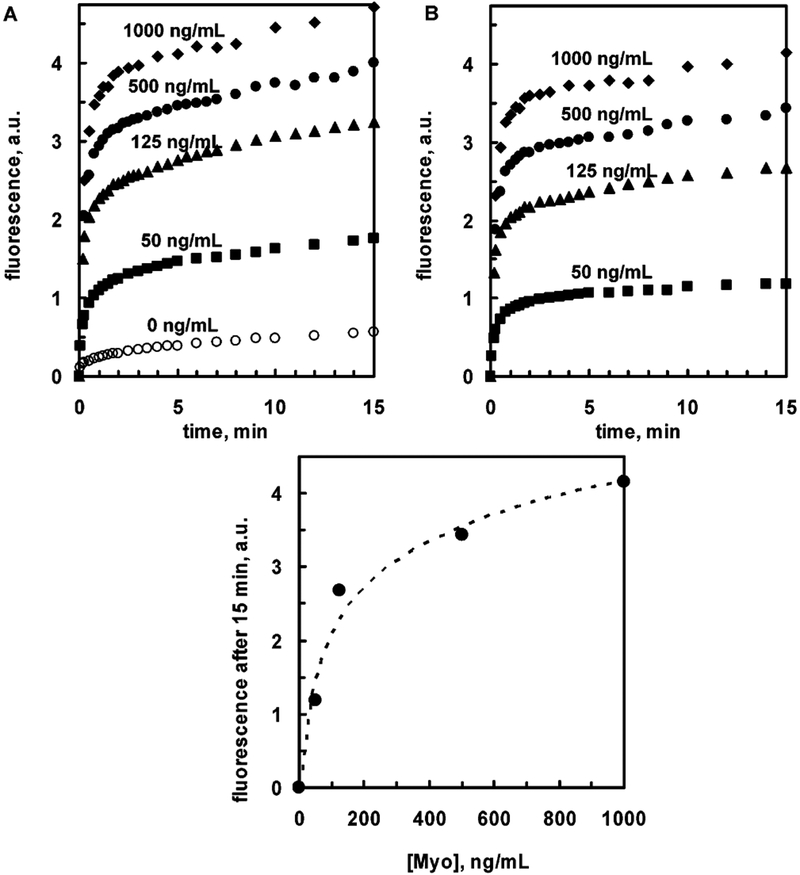
Figure 5.
Top: Kinetics of binding of the Rhodamine Red-X-labeled anti-myoglobin antibodies to myoglobin (0–1000 ng/mL) captured on the 50-nm silver mirror surface observed with KR/SPCE configuration: A, noncorrected data; B, data after subtraction of background. Bottom: Dependence of SPCE signal (after 15 min) on the Myo concentration. Dashed line represents the log trend (linear at log Myo concentration scale).

