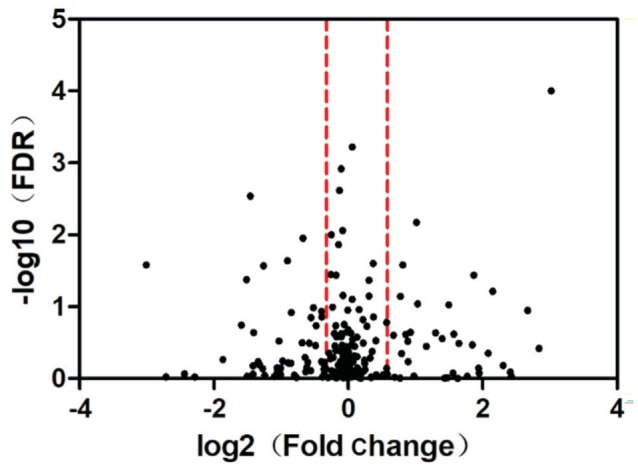
Figure 1. The Volcano pattern of DEPs.

The graph's horizontal axis represents log2 (fold change) and the vertical axis represents -log10 (FDR). Two dotted red lines separates the Figure into three parts. The rightmost part shows 38 proteins were up-regulated and the leftmost part shows 51 proteins were down-regulated. And the middle part remains relatively unchanged.
