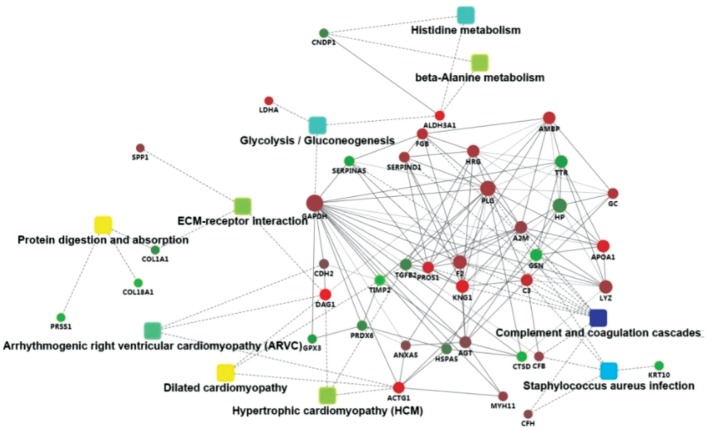
Figure 4. PPI network.
PPI analysis displayed the signaling network between the DEPs. Red dots represent up-regulated proteins and green dots represent down-regulated proteins. Squares link to proteins represent the main functions of relevant proteins. Solid lines represent direct relationships and imaginary lines represent predictive relationships.

