Figure 6.
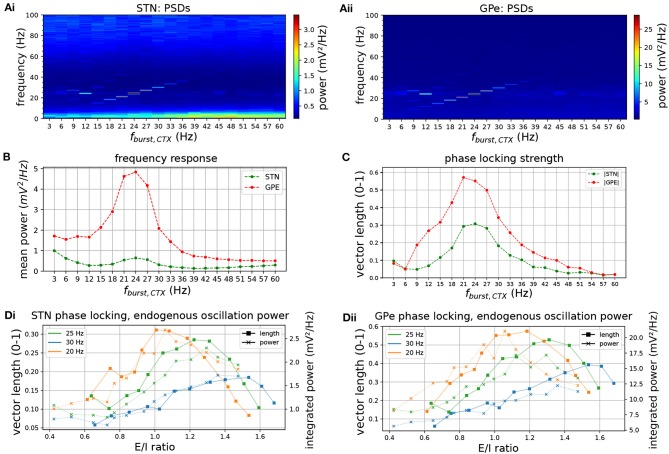
Frequency response and phase locking of the STN-GPe network to cortical oscillatory bursting inputs. Sweep of cortical oscillation frequency (top row) and phase locking to cortical oscillations for increasing CTX-STN synapse strength (bottom row). (A) Mean PSD of somatic membrane voltages in STN (Ai) and GPe (Aii) for increasing oscillatory bursting frequency. (B) Mean PSD of the somatic membrane voltages of STN (green) and GPe (red) neurons, averaged within a 5 Hz wide frequency band centered on the cortical oscillation frequency. (C) Population vector length, indicating strength of phase locking to the cortical oscillation of STN (green) and GPe (red) neurons. (D) Change in population vector length (solid lines) for a fixed cortical oscillation frequency (20 Hz, 25 hz, 30 Hz in green, blue, orange, respectively) and increasing CTX-STN input synaptic conductance, reflected in an increased ratio of excitation to inhibition (E/I ratio). Endogenous oscillation power in simulations without oscillatory cortical input is plotted for comparison (dotted lines, power integrated in 5 Hz band centered on cortical frequency in equivalent simulation with cortical inputs). An increased E/I ratio results in maximum phase locking at a higher oscillation frequency, and power of endogenous oscillations follows trend of phase locking strength.

