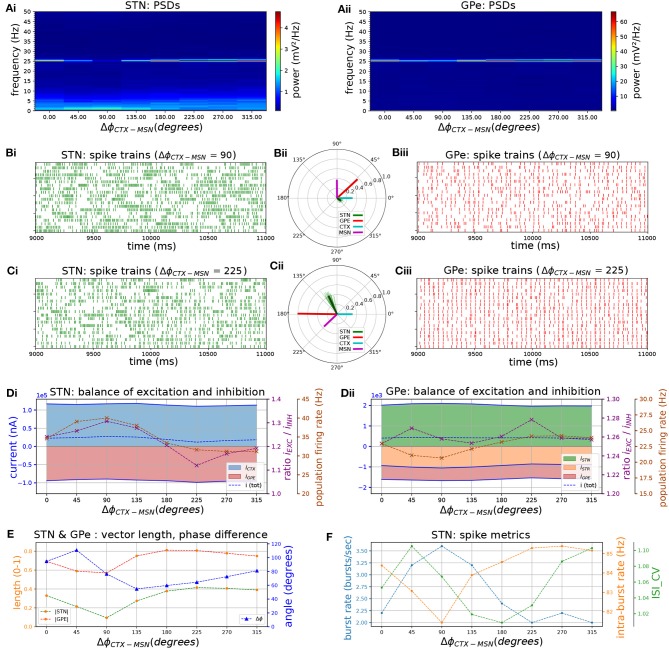
Figure 8.
The phase relationship between cortical and striatal beta-band inputs to the STN-GPe network affects the strength of phase-locking by setting the relative timing of excitatory and inhibitory STN afferents. Response of the STN-GPe network to oscillatory bursting inputs applied via both cortico-subthalamic (CTX-STN) and striato-pallidal (iMSN-GPe) afferents. The phase difference between cortical and striatal oscillatory bursts was increased in steps of 45°. All phase vectors were measured with respect to the instantaneous phase of the cortical oscillation. (A) Mean PSD of the somatic membrane voltages of STN (Ai) and GPe (Aii) neurons, showing weakening and strengthening of oscillations as relative phases of inputs are rotated. (B,C) Representative spike trains and phase vectors of STN (column i, green) and GPe population (column iii, red) for CTX-iMSN phase difference of 90° (C) and 225° (D). Column ii shows phase vectors of the STN, GPe, CTX, iMSN populations (in green; red; blue; purple, respectively; mean population vectors plotted as thick solid lines and cell vectors as thin transparent lines). (D) Balance of excitation and inhibition in the STN (Di) and GPe (Dii) based on synaptic currents recorded in three neurons. Population firing rate (brown), E/I ratio (purple), and net synaptic current (blue). Shaded areas represent estimated total synaptic current from one pre-synaptic population during a simulation. (E) Population vector length and angle of STN (green) and GPe (red) population. (F) Metrics that characterize bursting in STN neurons: median burst rate, intra-burst firing rate, and coefficient of variation of ISIs across all STN cells.

