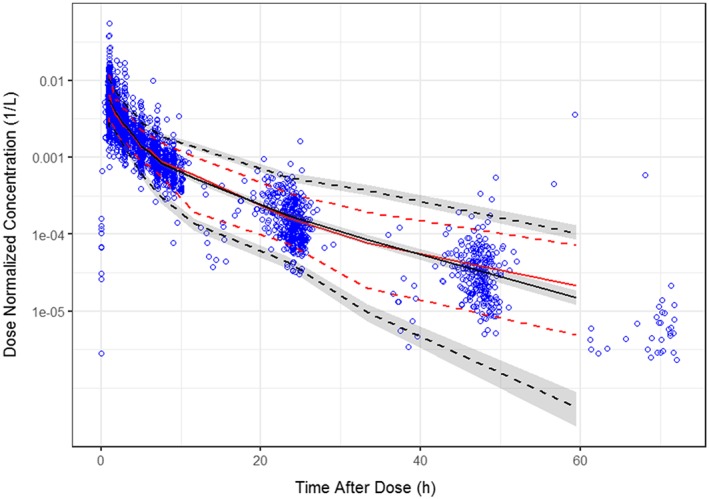
Figure 1.

Visual predictive checks results for final model—observed and simulated pevonedistat dose‐normalized concentrations vs time after dose—all data. Blue open circles are the observed data; solid red line is the median of the observed data; red dashed lines are the 5th and 95th percentiles of the observed data; black solid line is the median of the simulated data; black dashed lines are the 5th and 95th percentiles of the simulated data; grey shaded areas are the 95% confidence intervals associated with the simulated lower and upper percentiles. The confidence intervals (CIs) are not computed beyond 60 hours as the number of observations is insufficient to determine confidence intervals
