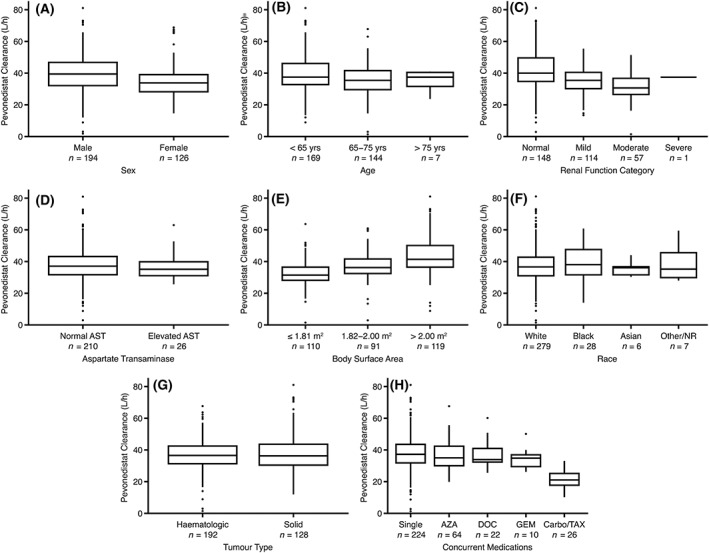
Figure 3.

Pevonedistat clearance by patient covariates. Horizontal lines comprising the box are the 25th, 50th (median) and 75th percentiles. The whisker ends denote 1.5 times the difference between the 25th and 75th percentiles and the symbols beyond the whiskers are the outliers
