Figure 5.

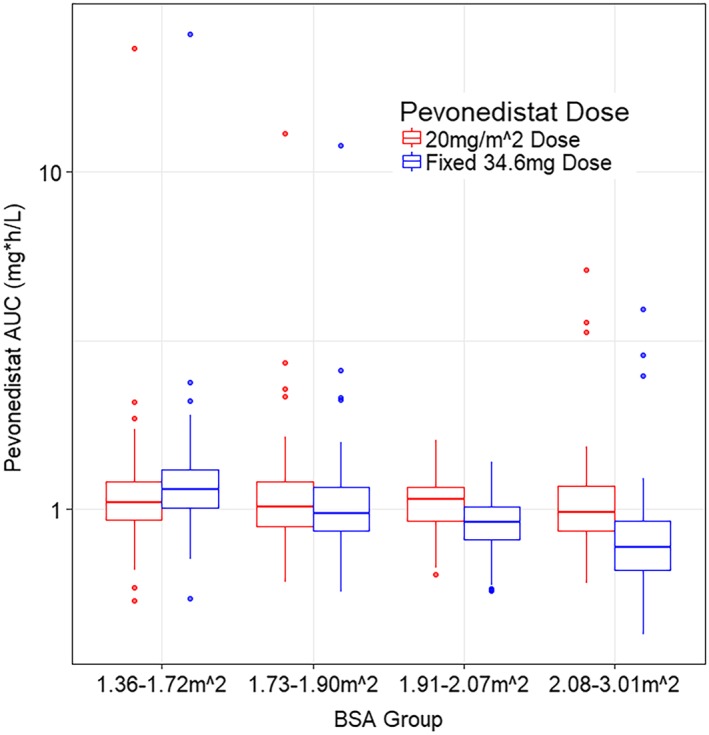
Simulated pevonedistat exposures following fixed (mg) vs BSA based dosing (mg/m2). AUC, area under the concentration–time curve; BSA, body surface area

Simulated pevonedistat exposures following fixed (mg) vs BSA based dosing (mg/m2). AUC, area under the concentration–time curve; BSA, body surface area