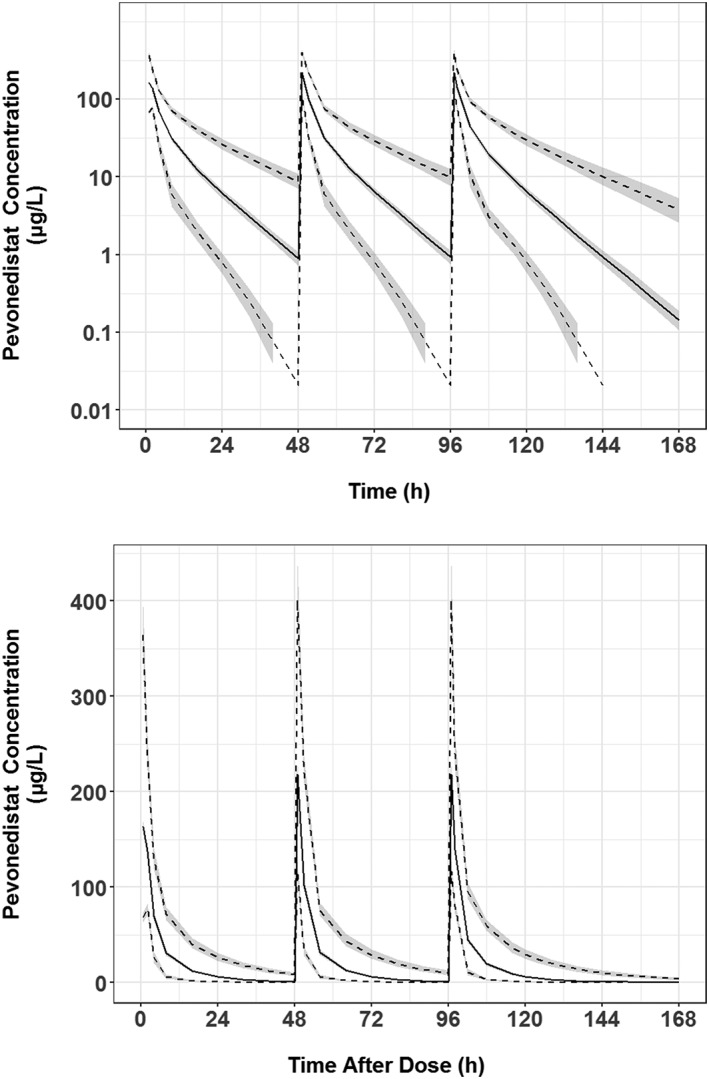
Figure 6.

Simulated pevonedistat concentration–time profiles at the recommended clinical dose of 20 mg/m2 administered on days 1, 3 and 5. Note: Black solid line is the median simulated concentration; black dashed lines are the lower 5th and upper 95th percentiles of the simulated data; grey shaded areas are the 95% confidence intervals for each percentile
