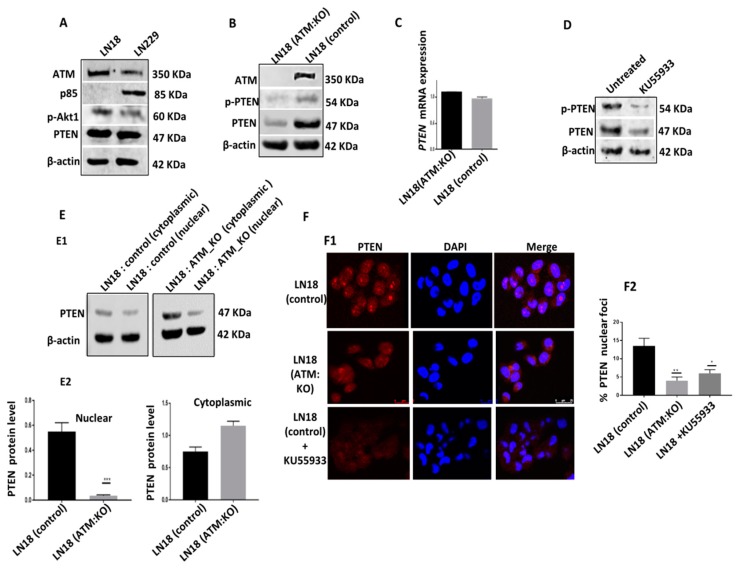
Figure 1.
Low PTEN protein level in ATM deficient cells. (A) ATM, PTEN, p-AKT1 and p85α levels in LN18 and LN229 cells. (B) LN18 ATM_KO was generated by CRISPR-cas9 and levels of total PTEN and P-PTEN (Ser380/Thr382/383) were assessed by western blotting. (C) Relative PTEN mRNA expression was assessed by RT-PCR. (D) LN18 control cells were treated with ATM inhibitor KU55933 for 24 h lysates were immunoblotted for PTEN and p-PTEN. (E) Nuclear and cytoplasmic fractionation of LN18 control and ATM KO cells. (F) Representative photomicrograph images showing PTEN translocation (100×). The data are representative of 3 independent experiments. Where appropriate, quantification is summarized in Supplementary Figure S1.

