Figure 5.
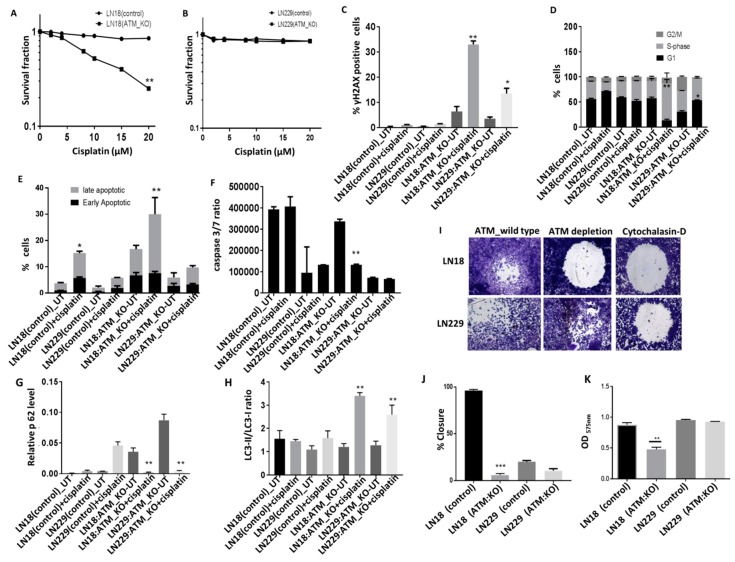
ATM depletion and platinum sensitivity. (A) Cisplatin sensitivity in LN18 control and ATM KO cells. (B) Cisplatin sensitivity in LN229 control and ATM KO cells. (C) LN18 control, LN229 control, LN18 ATM KO and LN229 ATM KO were treated with cisplatin for 48 h and γH2AX levels were analysed by flow cytometry. (D) Cell cycle analysis by flow cytometry for LN18, LN229 control and ATM KO cells treated with cisplatin. (E) Annexin V analysis by flow cytometry in LN18, LN229 control and ATM KO cells treated with cisplatin. (F) caspase 3/7 ratio by chemiluminescence detection in LN18, LN229 control and ATM KO cells treated with cisplatin. (G) p62 protein levels by western blotting in LN18, LN229 control and ATM KO cells treated with cisplatin. (H) LC3I and II protein levels by western blotting in LN18, LN229 control and ATM KO cells treated with cisplatin. (I) Representative photomicrographic images for migration assay for LN18and LN229 control and ATM KO cells. CytochalasinD (migration inhibitor 1.5 µM) was used as a negative control. (J) percentage closure quantification by imageJ software. (K) Invasion assay in LN18, LN229 control, and ATM KO cells. * p value < 0.05, ** p value < 0.01, *** p value < 0.001.

