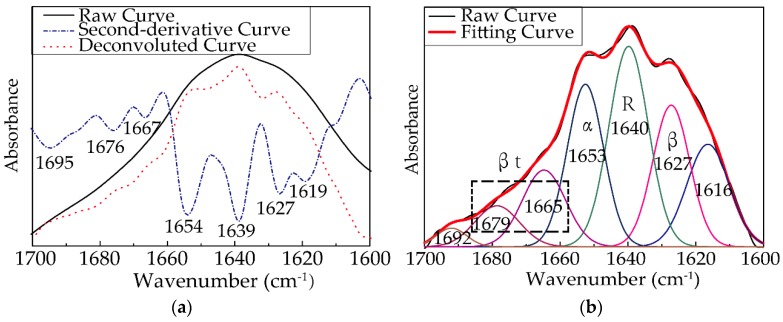
Figure 5.
(a) Raw curve (black line), deconvoluted curve (red dotted line), and second-derivative curve (blue dashed and dotted line) of the amide I absorption band of 25-F1 sample; (b) The quantitative analysis of the amide I band for 25-F1 sample (the black line is the original spectrum, the red line is the fitting spectrum, and the colorful lines are the contributions to the spectra from each type of secondary structure).

