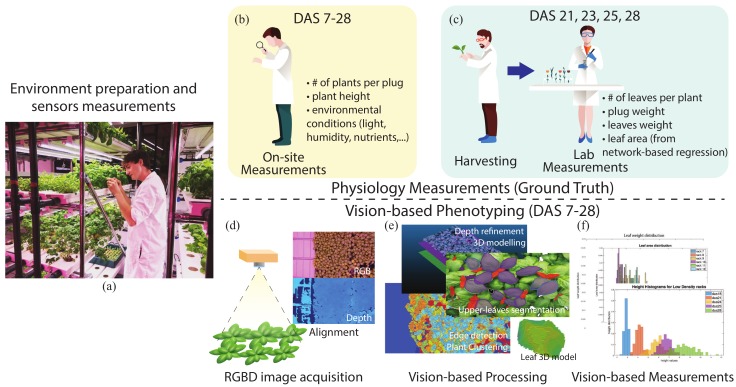
Figure 1.
The figure shows the schema of the two parallel computational processes leading to automatic measurements: the experiment setting (a); the manual data collection via on-site (b) and lab measurements (c); the images acquisition and alignment (d); and the ML and CV methods (e) to predict phenotype features, such as plants height, leaf area, and leaf weight (f).

