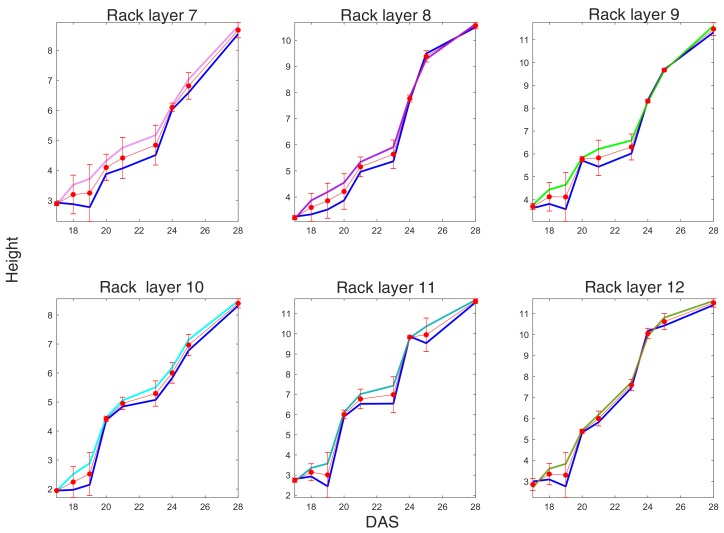
Figure 9.
Plant height trends compared with ground truth, from DAS 17 to DAS 28 for Racks 7–12. Recall that Racks 7–9 have low density, while Racks 10–12 have high density plants distribution. For each graph, blue represents the ground truth height measurement taken manually, and the other colors the height predicted according to the vision based methods. Finally, the graph line in red, with red markers, and orange errors segments, shows the distance (see Equation (8)) between the ground truth and the predicted height.

