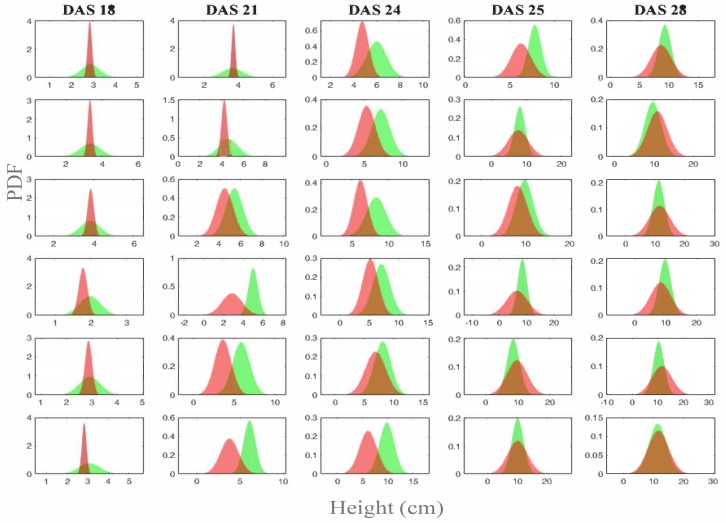
Figure 10.
Plants height distribution for DAS 18, 21, 24, 25 and 28, and for Racks 7–12. Recall that Racks 7–9 are low density, while Racks 10–12 are high density. In green is the probability density function (pdf) generated by the mean and variance of the manually collected height measures, and in red is the pdf generated by the predicted mean and variance. Note that the pdf does not need to be up to 1. We preferred to give the pdf because it better highlights the increase of the variance as DAS increases, and it shows that it is also wider for low plant density racks.

