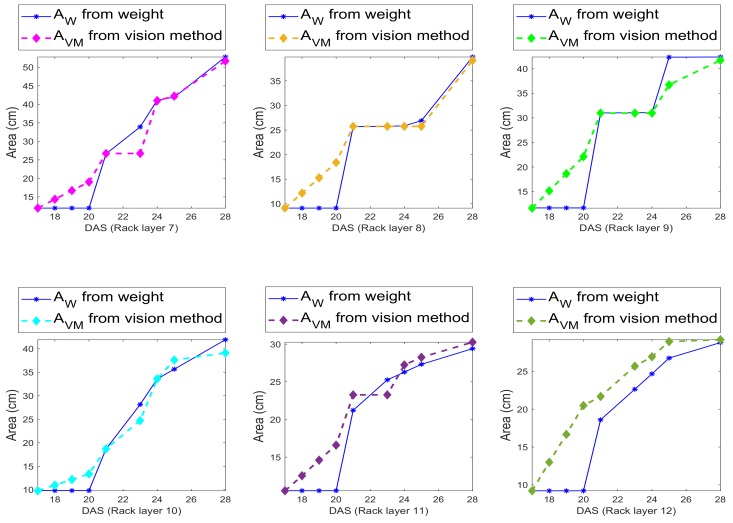
Figure 11.
Leaf area trends for both the area computed by training a small set of samples, and by vision method, as described in Section 4.3. Data from vision are given for DAS 18–28, while the leaf area computed by the network, using the manually measured weights is only for DAS 21, 24, 25 and 28, for Racks 7–12.

