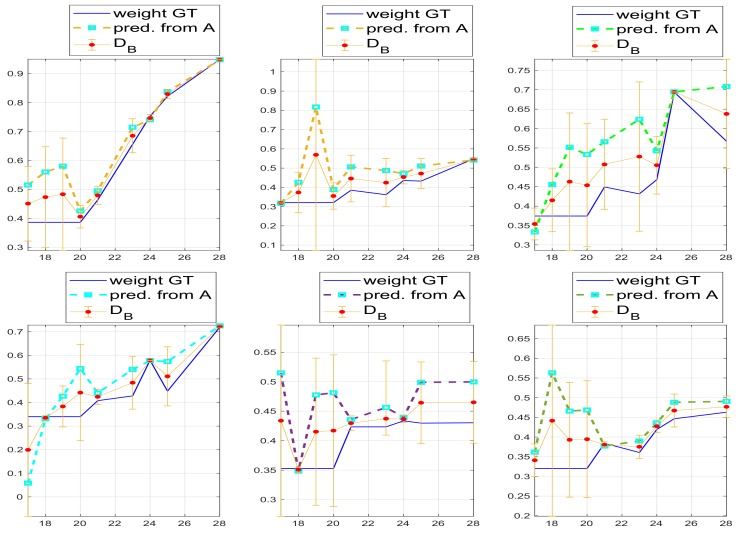
Figure 12.
Leaf weight trends both computed from the predicted leaf area and as given by the manual measurements. As for plants height the error is computed basing on the Bhattacharyya distance between probability functions (see Equation (8)), for the same reasons, namely we have comparable probabilities, although not comparable samples. In fact, data from vision are given for DAS 18–28, while the area computed by the network, using the weights the leaf area, are limited to DAS 21, 24, 25 and 28, for Racks 7–12. We recall that Racks 7–9 (top) are low density plant distribution, while Racks 10–12 (bottom) are high density plants distribution.

