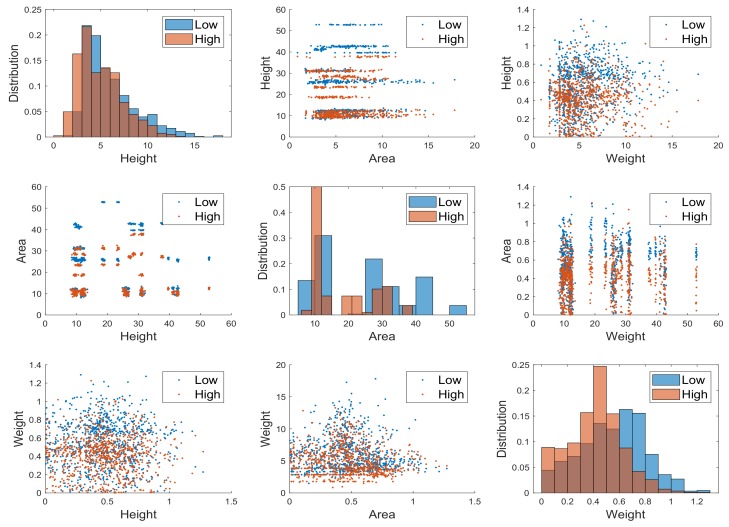
Figure 13.
Features plants height, leaf area and leaf weight data as a pairwise scatter plot. The diagonal plots the marginal histograms of the three features. The off diagonals contain scatterplots of all possible pairs of features. As indicated in the legend, brown points are related to feature of plants gathered in low density racks, while the azure points are related to features of plants gathered in high density plants.

