
Figure 2.
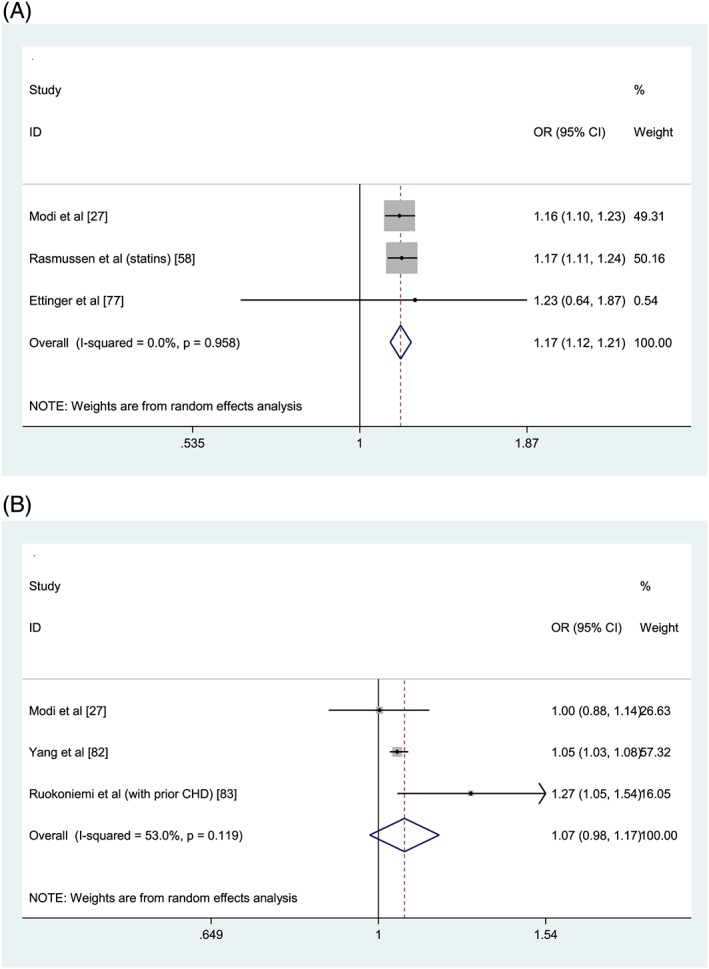
Forest plots of medication non‐adherence and association with all‐cause hospitalisations (A) and disease‐specific hospitalisations (B). OR = odds ratio; CI = confidence interval; PDC = proportion of days covered; MPR = medication possession ratio. Reference group: Adherent (PDC/MPR ≥80%). Intermediate adherence (PDC 40–79%) results are reported for Rasmussen et al. in (A). All‐cause hospitalisation (Figure 2A): Heterogeneity: χ2 = 0.08 (d.f. = 2), P = .958, I2 = 0.0% τ2 = 0.0000. Test for overall effect: Z= 7.65, P < .0001. Disease‐specific hospitalisation (Figure 2B): Heterogeneity: χ2 = 4.26 (d.f. = 2), P = .119, I2 = 53.0%, τ2= 0.0035. Test for overall effect: Z= 1.47, P =.143