
Figure 3.
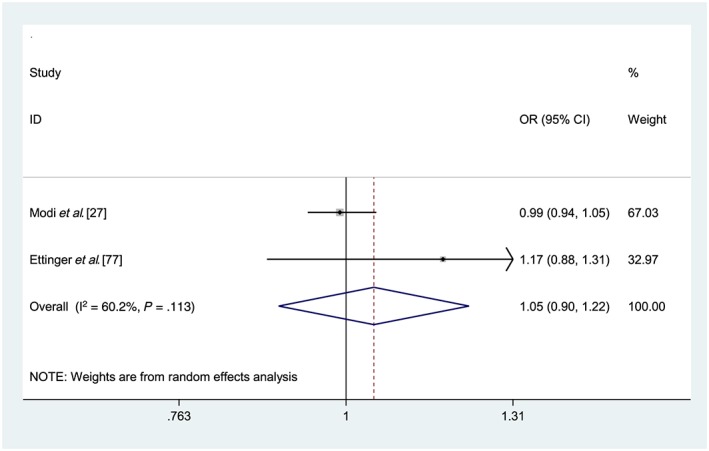
Forest plot of medication non‐adherence and association with emergency department visits. OR = odds ratio; CI = confidence interval; PDC = proportion of days covered; MPR = medication possession ratio. Reference group: Adherent (PDC/MPR ≥ 80%). Heterogeneity: χ2 = 2.51 (d.f. = 1), P = .113, I2 = 60.2%, τ2= 0.0084. Test for overall effect: Z= 0.57, P = .566