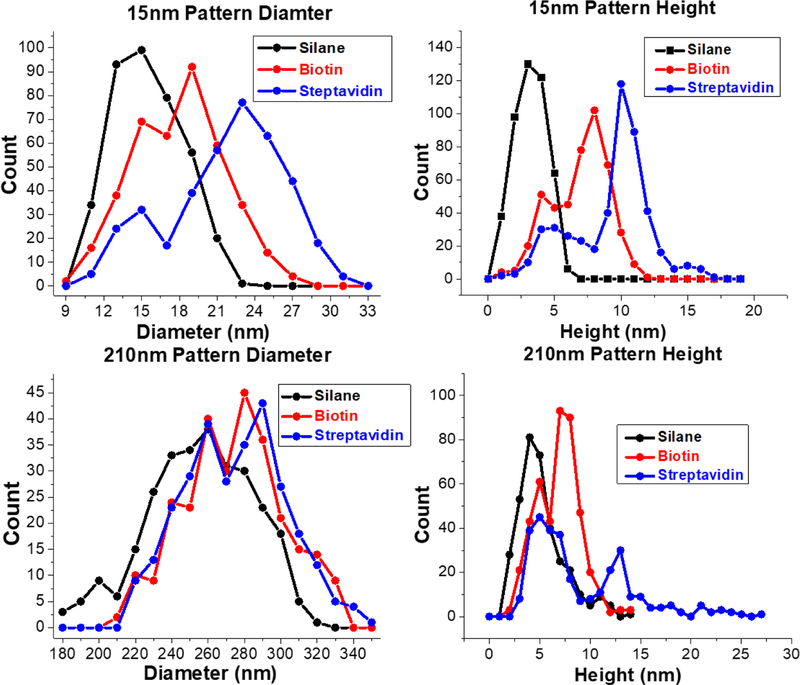
Figure 2.
Particle analysis of AFM images of 15 nm and 210 nm patterns. Left are the diameter distribution of the AUTES, biotin, and streptavidin patterns for 15 nm and 210 nm. The right side are height distribution of the AUTES, biotin, and streptavidin. Each iterative step of the patterning process results in increases to both diameter and heights. The bin width of the 15 nm diameter histogram is 3 nm. The bin width of the 210 nm diameter histogram is 10 nm. The bin width of both the 15 nm and 210 nm height histograms is1 nm.

