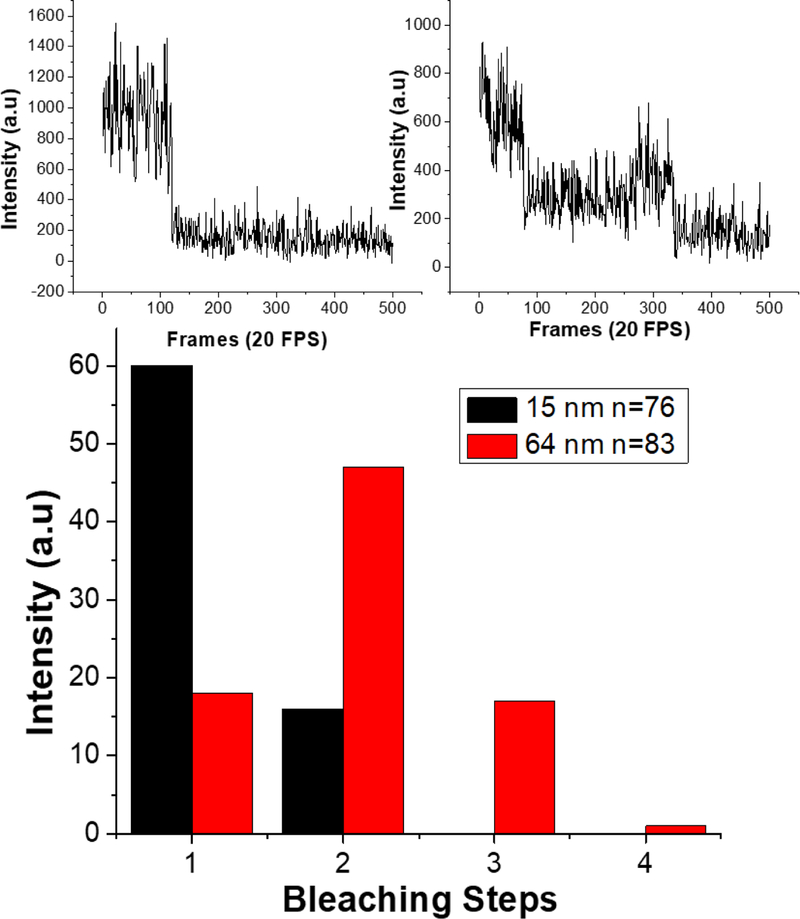
Figure 3.
Bleaching steps analysis of 15 and 64 nm hole mask patterns and sample raw bleaching data. Most of the 15 nm spots exhibit only single bleaching steps with a maximum of 2 steps, while the larger 64 nm spots show mostly 2 bleaching steps and a maximum of 4 steps. Example plots of fluorescence intensity versus a number of frames or time are shown above. The upper left plot shows a single bleaching step, indicative of a single fluorophore present, whereas the upper right plot shows multiple bleaching steps.

