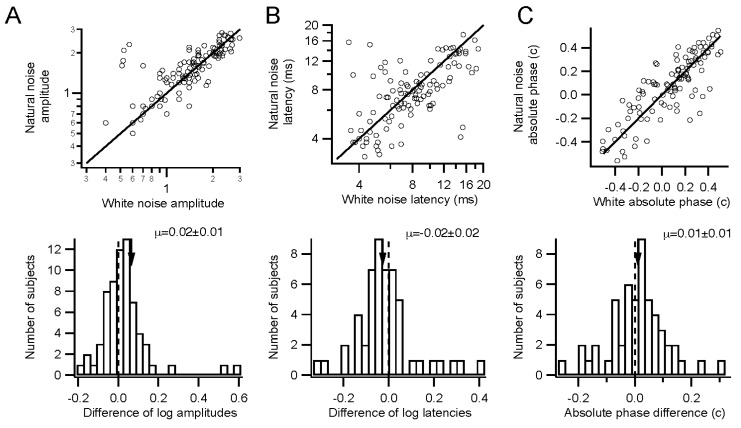
Figure 2.
Discounting temporal correlations. (A) Amplitudes (arbitrary units) measured across a population of 67 subjects for natural (vertical axis) and white noise stimulation are plotted (upper graph). The ratio between the natural and white noise amplitudes is displayed as a histogram (lower graph) after averaging across the two eyes for each subject. Log mean ratio of amplitudes (arrow) is 0.02 ± 0.01 (p = 0.1, paired t-test), corresponding to 6% higher amplitudes for natural noise; (B) Latencies are plotted as in A, with log scaling. The log mean ratio of latencies is −0.02 ± 0.02 (p = 0.26). This corresponds to a mean ratio of latencies of 0.96; (C) Absolute phase values are plotted as in A. The mean difference in absolute phase is 0.01 ± 0.01 c (p = 0.36). Absolute phase is a cyclic variable, so −0.5 c is the same as +0.5 c.

