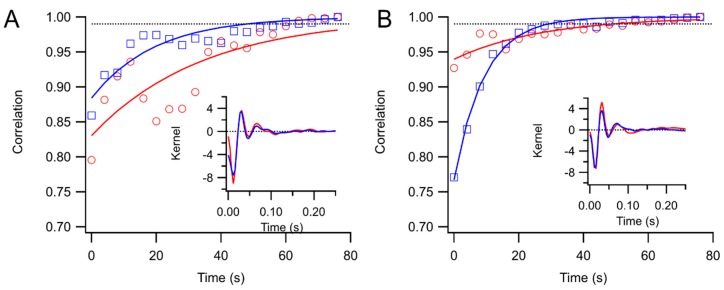
Figure 3.
Examples of kernel convergence. Correlations of running kernel estimates with the final kernel are shown against testing time. The curves are exponential fits. The dotted line is at 0.99. The final kernels are shown in the insets. Traces with red circles are right eye and with blue squares left eye. (A) Natural noise; (B) Gaussian white noise.

