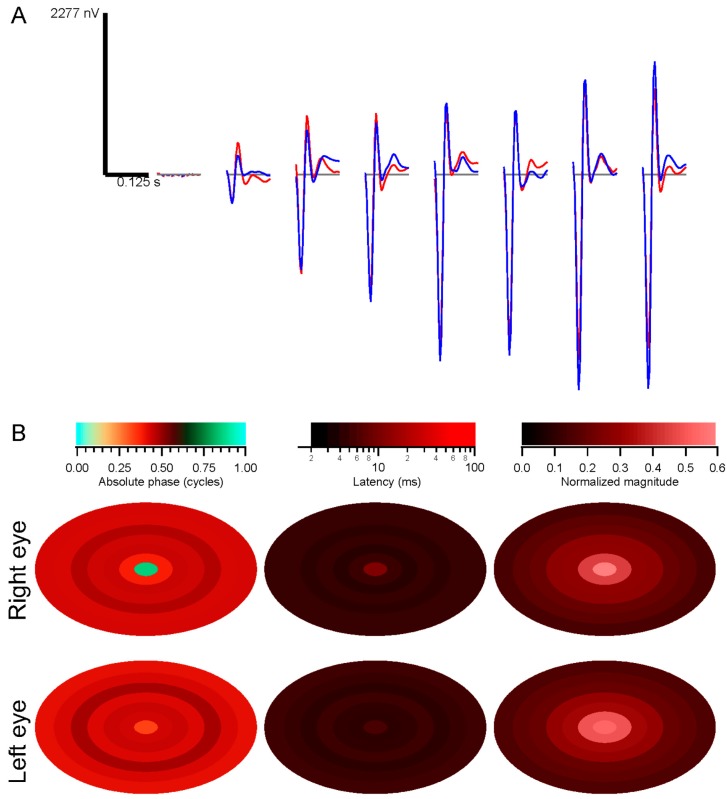
Figure 4.
Conventional analysis: (A) subject was tested with seven concentric rings. Kernels from each ring are shown, moving from the central ring on the left to the most peripheral ring on the right. Kernels at the far left are controls. Red traces are from the right eye, blue from the left eye; (B) Summary of parameters measured from the kernels. Absolute phase, latency, and normalized magnitude are illustrated as pseudocolor plots against the stimulus spatial configuration. Magnitudes were normalized by stimulus area.

