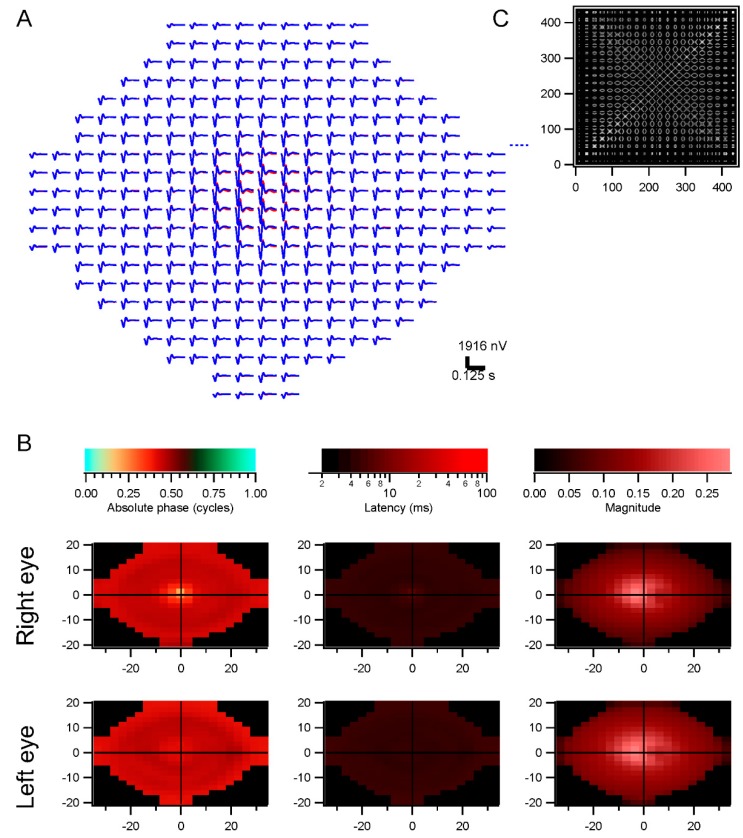
Figure 5.
Retinotopic analysis. The data shown in Figure 4 were analyzed across 441 retinal locations. (A) Trace array showing the kernels derived for each retinal location. Red traces are from the right eye, blue from the left eye; (B) Parameter plots as in Figure 4B but across retinal locations; (C) Mean correlations across the 441 locations. Some locations were rejected because of low contrasts.

