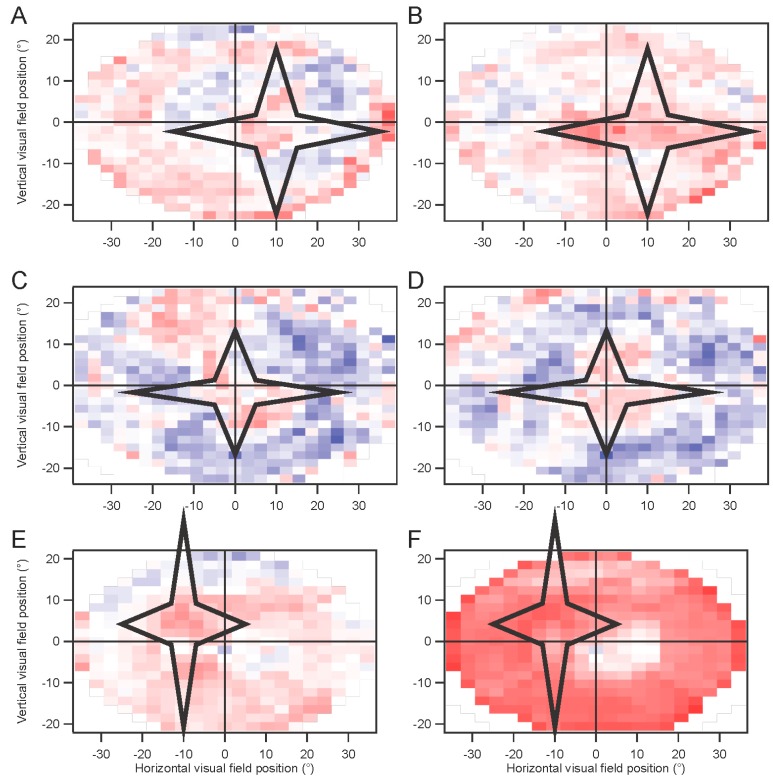
Figure 10.
Artificial retinal scotoma. Examples from both eyes in three subjects are shown as visual field maps of the index based on amplitudes without and with a scotoma. Left eyes are shown on the left (A,C,E). Red color indicates positive indices, meaning smaller responses in the presence of a scotoma. P values for the difference between indices of positions inside vs. outside the scotoma are: 0.35 (A); 6 × 10⁻⁹ (B); 4 × 10⁻⁶ (C); 3 × 10⁻¹⁶ (D); 8 × 10⁻⁷ (E); 0.014 (F), via t-tests.

