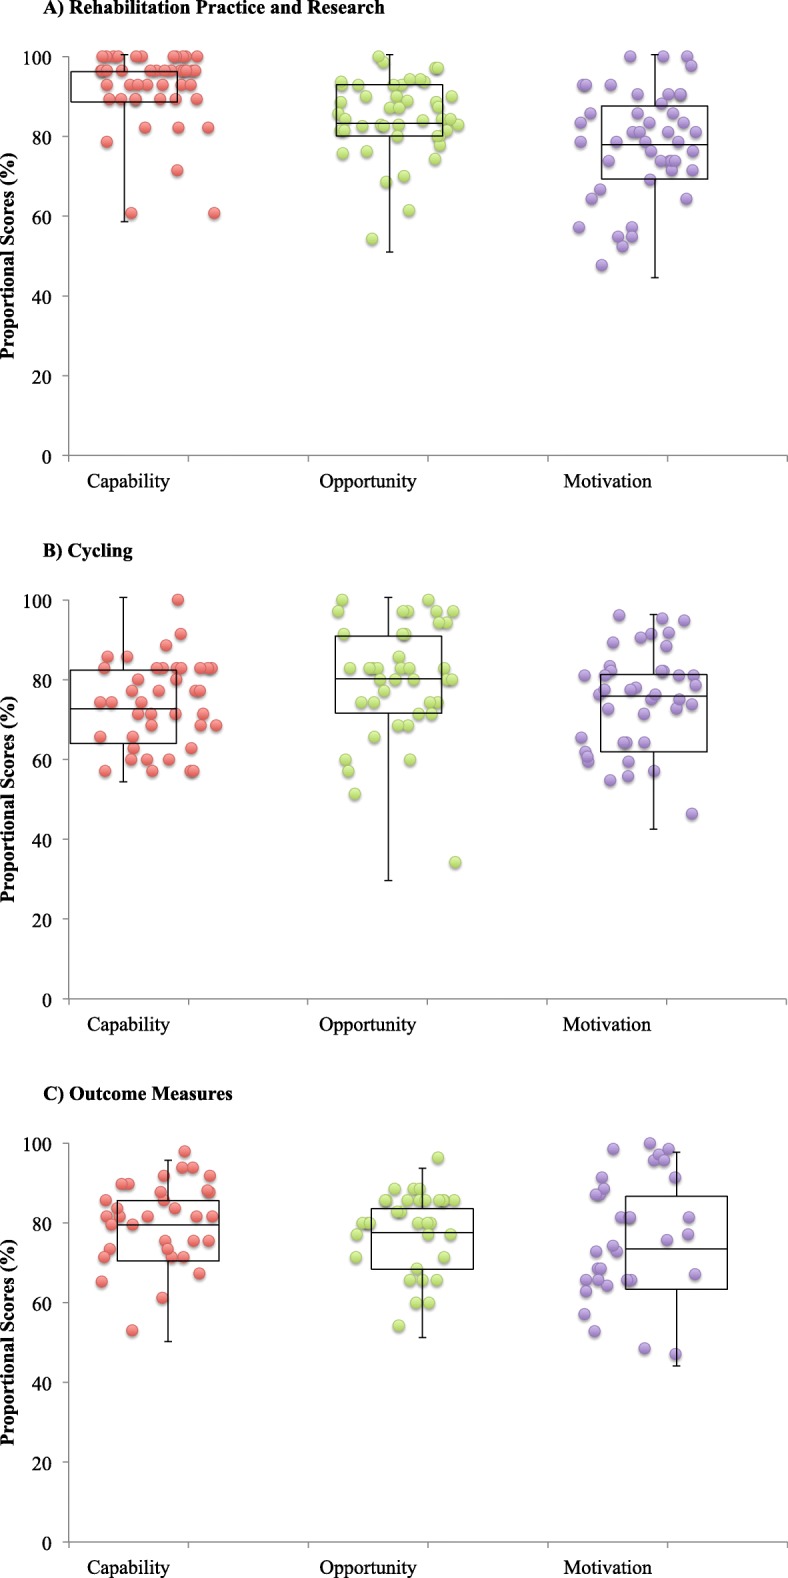
Fig. 2.

Distribution of respondents’ median proportional scores for items contributing to Capability, Opportunity, and Motivation for a Rehabilitation Practice and Research (n = 45), b Cycling (n = 40), and c Outcome Measures (n = 33). Box plots represent the median score across all respondents’ (horizontal line) and 1st and 3rd quartiles (top and bottom of the box, respectively)
