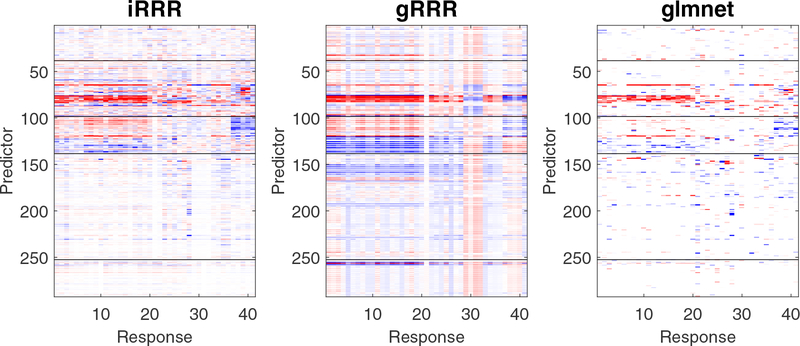
Figure 5:
LSOA data analysis. The heat maps of the coefficient matrices estimated from different methods. The predictors fall into 5 groups, namely, housing condition, family status, daily activity, prior medical condition, and change in medical procedure since last interview, from top to bottom separated by horizontal black lines. For visualization purpose, we also sort the responses based on their grouping structure (e.g., cognition, sensation, social behavior, and life quality).

