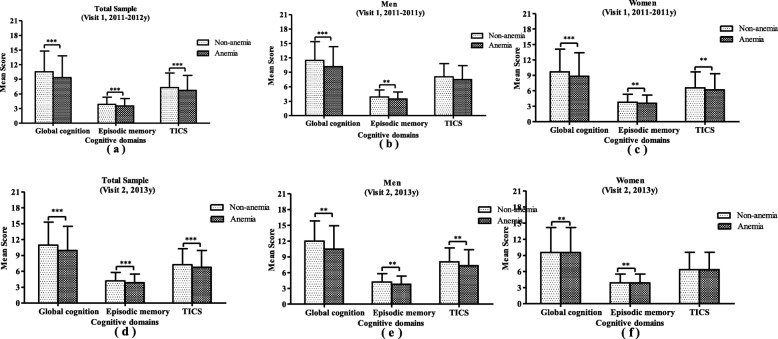
Fig. 2.
Age-adjusted comparison of Cognitive measures between anemic and non-anemic groups by gender. The mean value of Cognitive Test Scores measured at baseline survey (2011-2012y) between anemia and non-anemia group is illustrated separately for global cognition, episodic memory, and TICS among the total sample (Panel a), among men (Panel b), and among women (Panel c). The mean value of Cognitive Test Scores re-measured at follow-up survey (2013y) between anemia and non-anemia group is illustrated separately for global cognition, episodic memory, and TICS among the total sample (Panel d), among men (Panel e), and among women (Panel f). *** means p < 0.0001; ** means p < 0.001

