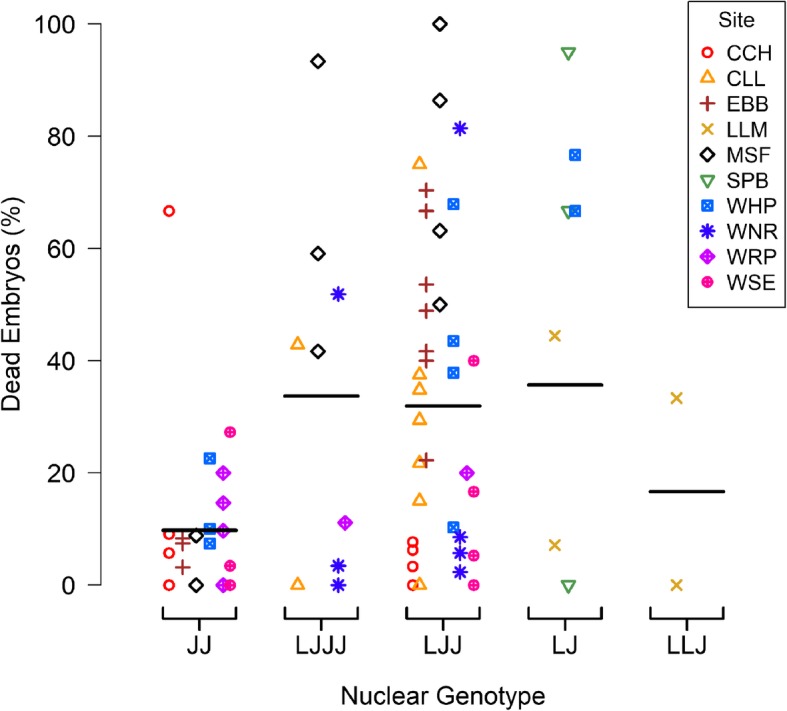
Fig. 2.

Observed frequency of dead embryos in field surveys at 10 sites across Massachusetts. Each point represents a whole egg mass, with genetic identity inferred by microsatellite markers from a single embryo taken from the egg mass, whereas nuclear genotypes are known to vary amongst embryos in a mass. The horizontal lines represent the mean percent dead embryos among masses within each genotype group. In describing nuclear genotypes, the number of times each letter is repeated represents the number of copies of each genome set, with “L” for Ambystoma laterale and “J” for A. jeffersonianum
