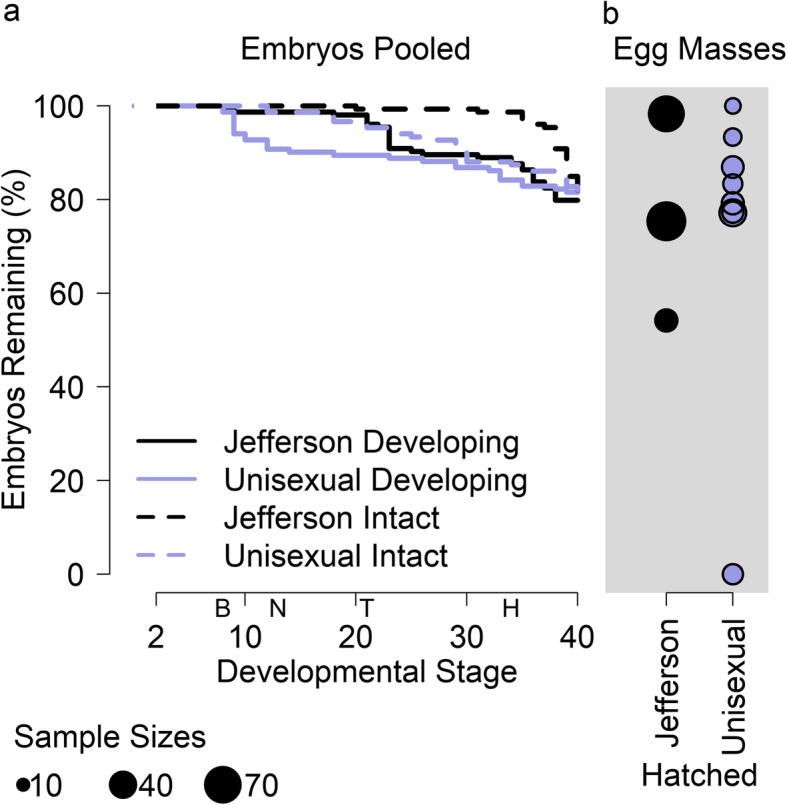
Fig. 3.

Survival of lab-reared Jefferson and unisexual salamander embryos, excluding those sacrificed for further laboratory testing. a Survival curves of all embryos that entered cleavage (stage 2). Solid lines track survival until development stopped advancing. Dotted lines track survival until embryos turned white across expected developmental stage, which is based on the stage of neighboring embryos in the egg mass when the focal embryo turned white. The horizontal space between solid and dotted lines represents the approximate delay between embryo death and the outward appearance of decay. The letters on the x-axis represent the blastula stage (“B”), the beginning of the neurulation (“N”), the beginning of the tail-bud (“T”), and the beginning of the heartbeat (“H”). b Hatching success, where each point represents one egg mass. The area of the circles reflect the relative number of embryos (ranging from 12 to 69) in each mass. None of the embryos in the one egg mass with complete mortality entered the cleavage stage, and so this egg mass is not represented in the survival curves to the left. All embryos in all other masses entered cleavage
