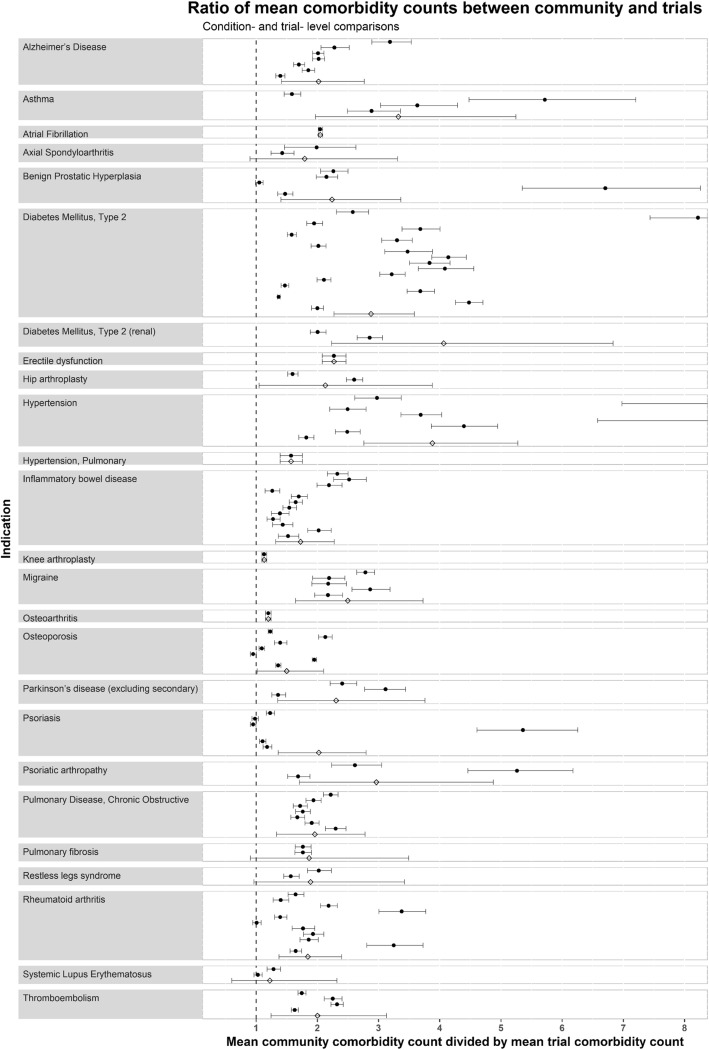
Fig. 4.
Ratio of mean comorbidity counts between community and trials: condition- and trial-level comparisons. Points represent the ratio of mean count between community patients and trials, and the bars represent 95% credible intervals. Trial estimates are represented by solid circles, and index-condition-level meta-estimates are represented with empty diamonds. The ratio represents the mean community comorbidity count for that index condition, divided by the mean trial comorbidity count, i.e. value of 1 indicates no difference in mean comorbidity count, value of 2 indicates the mean comorbidity count is twofold higher in community than in trials, etc. An interactive version of this figure, with links to the clinicaltrials.gov registration for each trial, is shown in Additional file 12

