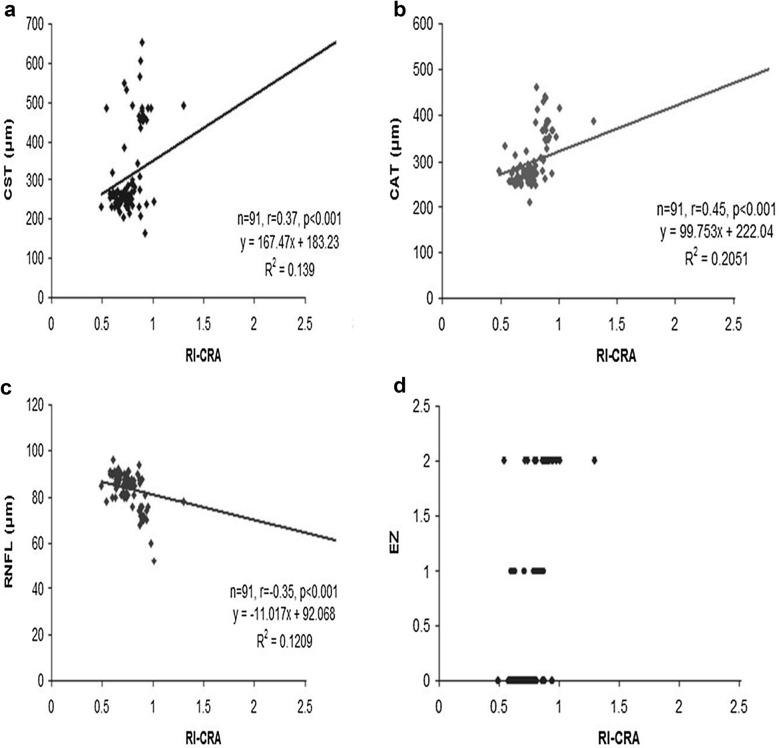
Fig. 2.
a Scatter plot illustrating correlation between resistive index (RI) of central retinal artery (CRA) and central subfield thickness (CST). b Scatter plot illustrating correlation between resistive index (RI) of central retinal artery (CRA) and cube average thickness (CAT). c Scatter plot illustrating correlation between resistive index (RI) of central retinal artery (CRA) and retinal nerve fibre layer thickness (RNFL). d Scatter plot illustrating correlation between resistive index (RI) of central retinal artery (CRA) and ellipsoid zone (EZ) disruption

