Fig. 5.

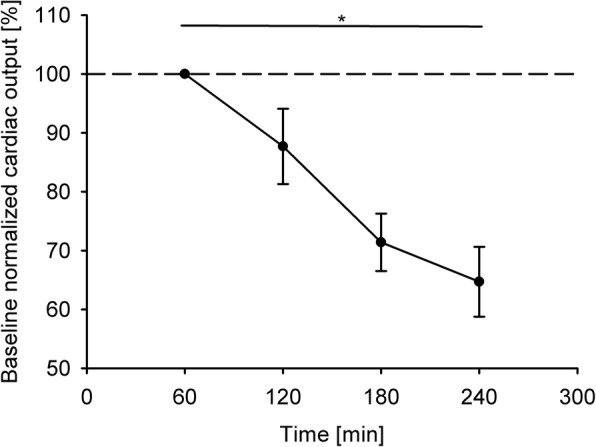
Progression of the cardiac output across all the experiments. The values are presented as a percentage of their baseline value. * indicates a statistically significant difference

Progression of the cardiac output across all the experiments. The values are presented as a percentage of their baseline value. * indicates a statistically significant difference