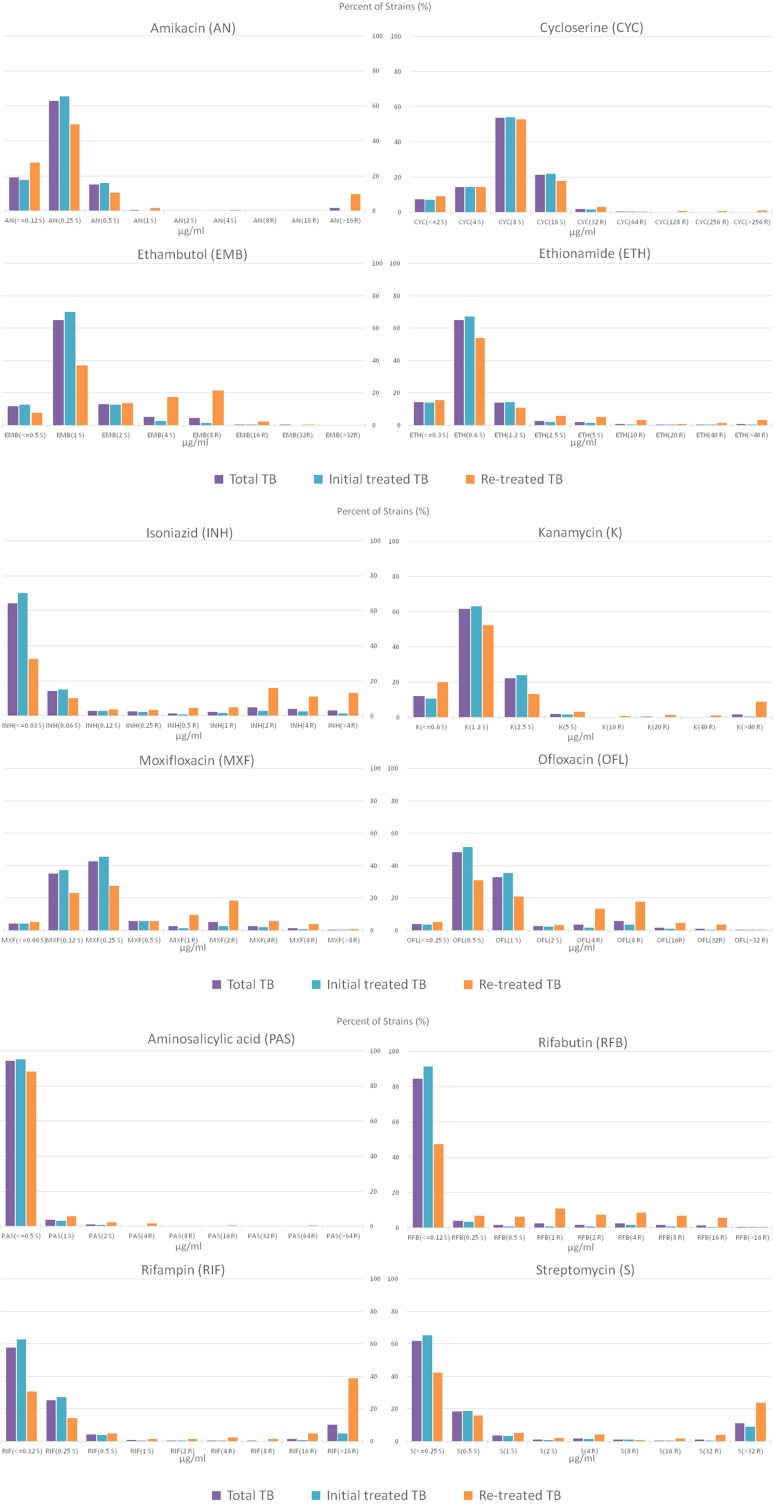
Figure 3.
Percentage distribution plot of MICs of amikacin, cycloserine, ethionamide, ethambutol, isoniazid, kanamycin, moxifloxacin, ofloxacin, aminosalicylic acid, rifabutin, rifampin and streptomycin, against MTB isolates isolated from total TB, initial treated TB and re-treated TB. S and R after the MIC concentration represent sensitivity and resistance, respectively.

