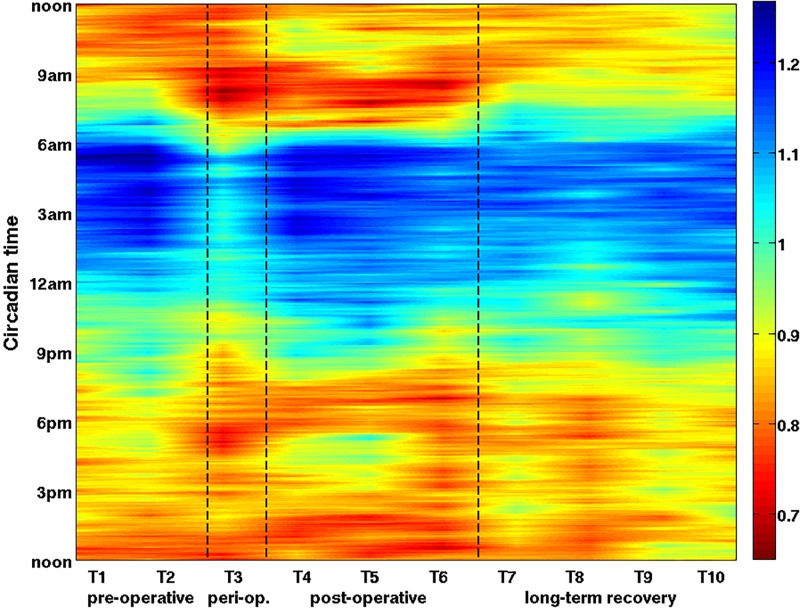
FIGURE 2.
The overall dynamics of the vagal activity during the operation-rehabilitation process. Each color represents the value of the vagal activity averaged over all 16 patients on a given measurement day (horizontal axis, T1–T10) and at a given circadian hour (vertical axis, time runs from bottom to top). Clinical phases are also indicated on the horizontal axis. Each averaged vagal activity value is represented as a color, where red means low and blue means high vagal activity (see color bar). Phases of the operation-rehabilitation process are delimited by the dashed lines. Vagal activity is reduced during peri-operative phase (T3), especially during the night. During the post-operative rehabilitation (T4–T6) original vagal activity values are gradually restored. See also our statistical analysis (Tables 1, 2), which confirms the statistical significance of the vagal activity changes.

