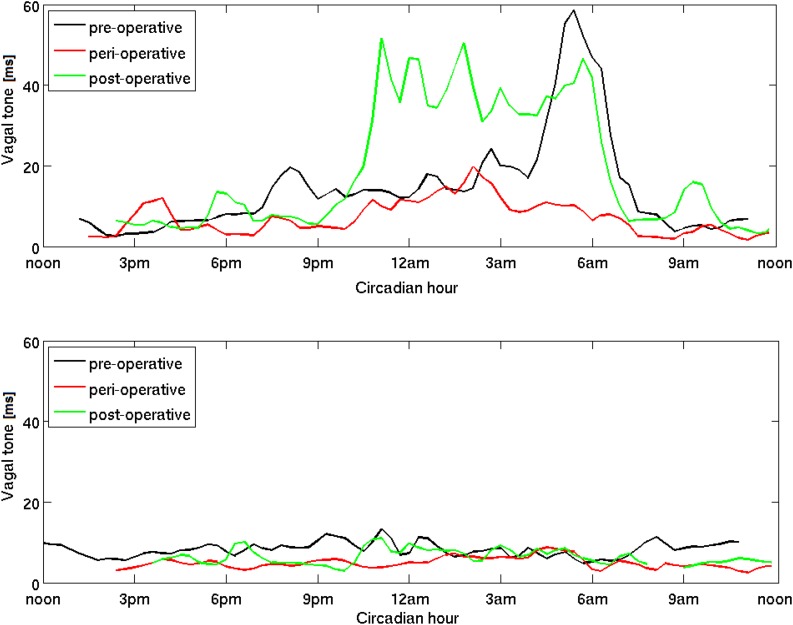
FIGURE 4.
Circadian dynamics of vagal activity (vagal tone) during the operation-rehabilitation process. A patient with a strong pre-operative vagal activity is shown in the top panel and another patient with a weak pre-operative vagal activity is shown in the bottom panel. Three circadian time series for the entire 24 h cycle are shown in each panel, measured on three specific days, pre-operative on T1, peri-operative on T3 and post-operative on T5. We remove the logarithmic scale for better clarity (see section “Materials and Methods”) and use the moving average over a window of several minutes to avoid minute-to-minute fluctuation. While the patient in the top panel shows a clear improvement of post-operative vagal activity, especially during the night, the patient in the bottom panel shows very little improvement, and even during the night.

