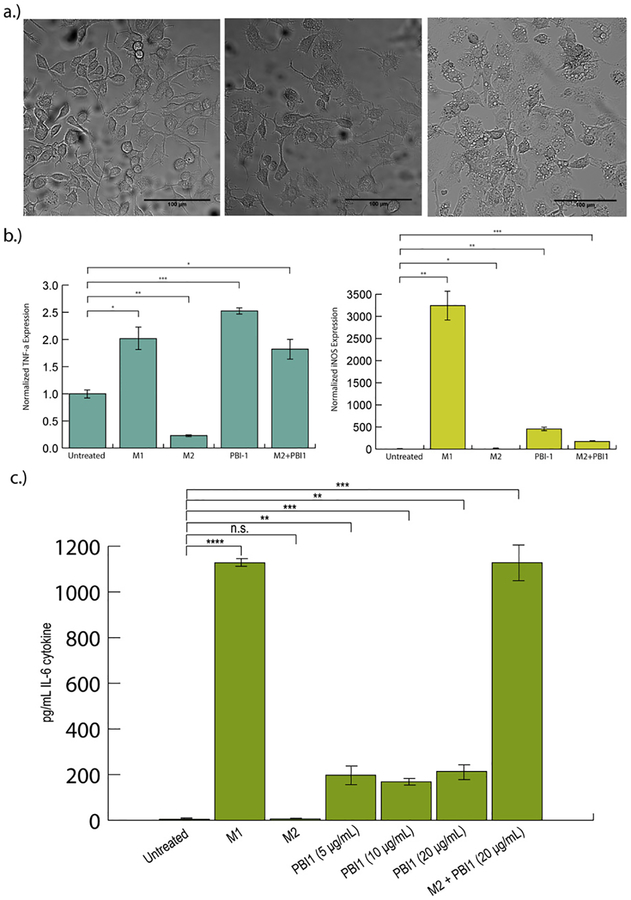
Fig. 2.
Effects of PBI1 treatment on cell morphology and M1 marker expression. a) Confocal microscopy images (20x) depicting changes in cell morphology following treatment with 20 μg/ml PBI1. PBI1-treated macrophages (center) resembled those polarized to an M1 phenotype (right), with a “flatter” appearance and more pseudopodia, in comparison with non-treated cells (left). b) RT-PCR analysis of TNF-α (left) and iNOS (right) expression in PBI1 treated cells revealed significantly greater expression of both relative to non-treated controls. M2 + PBI1 refers to cells polarized to the M2 phenotype and subsequently treated with PBI1. c) ELISA analysis of IL-6 secretion following treatment. Unpaired, two-tailed student T-tests with equal variance were used to determine significance; *P ≤ 0.05, **P ≤ 0.005, ***P ≤ 0.0005, ****P ≤ 0.00005. n.s. = non-significant.

