
Figure 2. Post-stimulation Brain State Depends on White Matter Network Architecture.
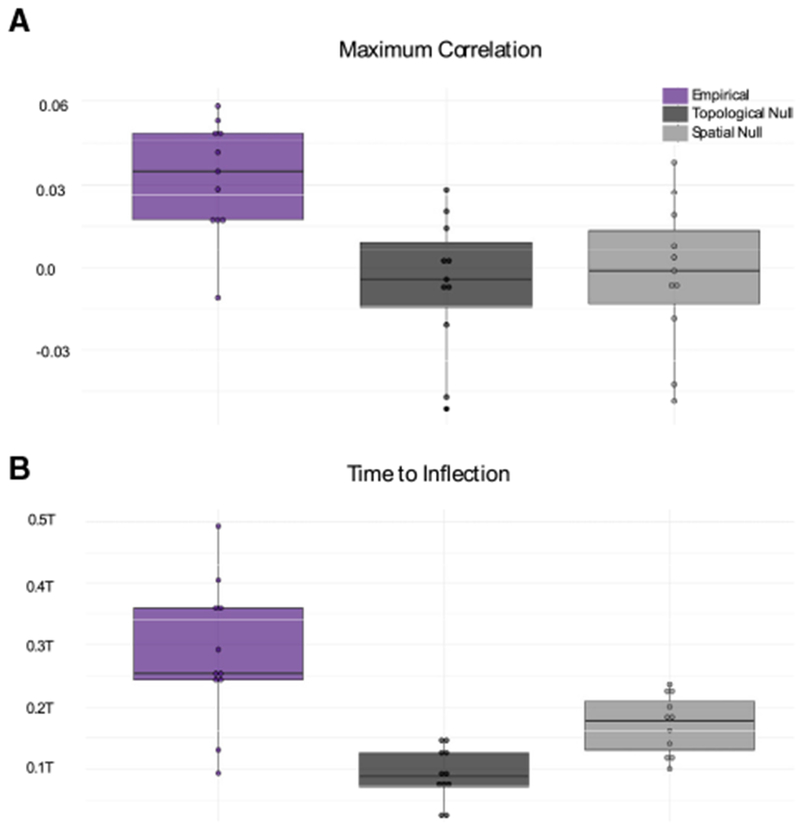
(A) Boxplots depicting the average maximum correlation between the empirically observed post-stimulation state and the predicted post-stimulation state at everytime point in the simulated trajectory x(t) for N = 11 subjects. Boxplots indicatethe median (solid horizontal black line) and quartiles ofthe data. Each data point represents a single subject, averaged over all of the trials (with different stimulation parameters).
(B) Boxplots depicting the average time to reach the peak magnitude (positive or negative) correlation between the empirically observed post-stimulation state and the theoretically predicted post-stimulation state at every time point in the simulated trajectory x(t). Time is measured in a.u. Color indicates theoretical predictions from Equation 1, where A is (1) the empirical network (purple) estimated from the diffusion imaging data, (2) the topological null network (dark charcoal), and (3) the spatial null network (light charcoal).
See also Figures S1 and S2.