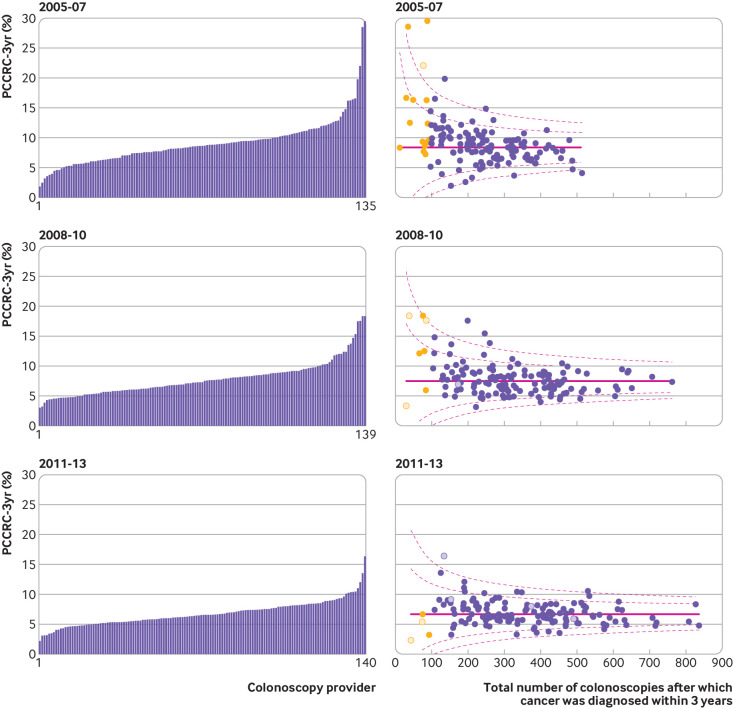
Fig 2.
Unadjusted variation in rates of post-colonoscopy colorectal cancer within three years of investigation (PCCRC-3yr) by provider for 2005-07, 2008-10, and 2011-13. In funnel plots each dot represents an individual colonoscopy provider. Dashed lines represent 95% and 99.8% control limits outside national PCCRC-3yr rate (solid line). X axis is number of detected cancers plus PCCRC-3yr cancers diagnosed in the period. Yellow dots indicate providers who diagnosed less than 96 cancers in the given period. Hollow dots represent independent colonoscopy providers

